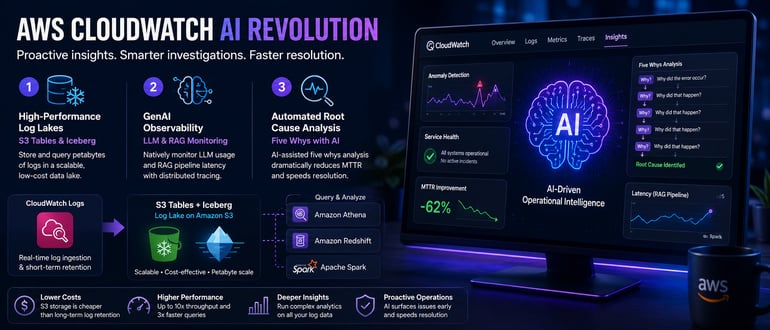

Traditional monitoring often meant chasing alerts and toggling between dashboards after an issue had already impacted users. AWS CloudWatch — long the backbone of metrics, logs and traces on AWS — is evolving past that reactive paradigm. The latest CloudWatch capabilities infuse AI-driven operational intelligence into observability, helping engineers surface issues before they escalate and accelerating root cause analysis when incidents occur. Rather than simply visualizing data on dashboards, CloudWatch now provides intelligent insights, anomaly detection and automated investigations. This fundamentally changes the software development engineer (SDE) workflow: Instead of manually correlating metrics and logs in a war room, teams wake up to proactive insights and guided troubleshooting. For AWS builders and architects, the focus shifts from babysitting infrastructure to building with confidence, as CloudWatch’s AI features handle much of the heavy lifting in monitoring and analysis.
In this article, we explore three game-changing advances in CloudWatch’s AI-driven observability suite and how they empower a proactive operations culture:
- High-Performance Log Lakes With S3 Tables & Iceberg: Build a scalable, low-cost ‘log lake’ on Amazon S3 for petabyte-scale analysis of log data.
- GenAI Observability: Natively monitor large language model (LLM) usage and retrieval-augmented generation (RAG) pipeline latency using new distributed tracing and curated dashboards.
- Automated Root Cause Analysis With Five Whys: Leverage CloudWatch’s AI-assisted ‘five whys’ incident analysis to drastically cut mean time to resolution (MTTR).
Throughout, we’ll maintain a professional, builder-focused lens, offering practical guidance (with console screenshots and code snippets) to implement these features and highlighting how they change day-to-day workflows for SDEs. Let’s dive beyond the dashboards and into the CloudWatch AI revolution.
Building a Petabyte-Scale Log Lake With S3 Tables and Iceberg
For several AWS teams, log data is a double-edged sword: It’s incredibly valuable for insights, but retaining and querying massive log volumes in CloudWatch Logs can become slow and expensive. Enter Amazon S3 Tables integration for CloudWatch Logs — a 2025 feature that lets you offload CloudWatch Logs to an S3-backed data lake in Apache Iceberg format. This integration automatically delivers new log events from CloudWatch to a managed ‘table bucket’ on S3, where logs are stored as Iceberg tables. In effect, CloudWatch Logs becomes a seamless firehose into your S3 data lake, bridging observability and big-data analytics.
Once ingested into S3, your logs are queryable by a variety of analytics engines (Athena, Amazon Redshift, Spark, etc.) using standard SQL. This means you can run complex aggregations or joins involving log data — for example, correlating application logs with business data in a data warehouse — all through familiar query tools. Iceberg’s table format brings schema to semi-structured logs, enabling efficient queries with partition pruning and without needing to manually parse millions of JSON lines. For SDEs, this is a game changer: Instead of writing ad hoc scripts or relying on CloudWatch Logs Insights for each log dive, you can analyze months or years of logs on demand with Athena or Spark, treating logs as another big data source in your lake.
Performance and Cost
Amazon S3 Tables are purpose-built for heavy analytics workloads. The S3 Tables service automatically optimizes the underlying Iceberg files with continuous compaction and metadata management. As a result, an S3 Table can handle up to 10× higher throughput (≈55k reads/sec and 35k writes/sec per table) compared to a standard S3 bucket used for data lakes. Query performance improves as small log files are merged into larger Parquet files in the background, potentially yielding 3x faster query run times, thanks to fewer overheads. All of this is fully managed — no EC2 clusters or manual compaction jobs for your team. From a cost perspective, you pay only the normal CloudWatch Logs ingestion fees and S3 storage costs; there is no additional charge to use S3 Tables integration. Given that S3 storage (especially with Intelligent-Tiering) is significantly cheaper per GB than long-term retention in CloudWatch Logs, this approach can slash costs for large log archives while preserving the ability to analyze data whenever needed. In short, you get a high-performance, low-cost log lake solution: CloudWatch handles real-time log ingestion and short-term retention, while S3 + Iceberg serves as the infinite, economical storage for historical analysis.
Getting Started
Setting up the S3 Tables integration is straightforward. In the CloudWatch Logs console, navigate to Settings (Global) and select ‘Create S3 Table Integration’. You’ll specify an IAM role for CloudWatch to use (to write to S3 on your behalf) and encryption preferences, then associate specific log groups (data sources) with this integration. CloudWatch will create a managed table bucket (named aws-cloudwatch) in S3. Each log group you associate becomes an Iceberg table within that bucket, continuously fed by new log events. On the S3 side, you need to enable Amazon S3’s integration with AWS analytics services (a one-time setup to allow Athena/Redshift to discover the tables) and configure AWS Lake Formation permissions so your analysts or applications can query the data. Post that, the log data is readily accessible. For example, in Amazon Athena’s query editor, you can switch the data source to ‘Amazon S3 Tables’ and immediately see databases and tables corresponding to your CloudWatch logs. Standard SQL queries can then be run on your log data – e.g., to find the top 10 error codes in an Apache access log table:
SELECT error_code, COUNT(*) AS occurrencesFROM "prod_webapp__apache_access_logs"WHERE error_code IS NOT NULLGROUP BY error_codeORDER BY occurrences DESCLIMIT 10;
Such a query might scan terabytes of log data on S3, yet complete in seconds on Athena due to Iceberg’s optimizations (partitioning, metadata pruning) and the power of serverless Presto. More importantly, this capability means engineers can proactively mine logs for patterns and anomalies at scale — something not feasible when limited to the 5–10 GB ranges of a typical CloudWatch Logs Insights query. Need to analyze a month’s worth of AWS VPC Flow Logs (which could be petabytes) for a security audit? Simply point Athena at the S3 table and crunch away. The S3 log lake decouples compute and storage, so you can retain raw logs for as long as required (compliance, historical trend analysis) without paying a fortune and spin up queries only when needed.
When to Use S3 Tables for Logs
Not every team or log source will need this integration, but it shines in a few scenarios:
- Long-Term Analytics & ML: You want to retain logs for months/years and run complex analyses or ML on them (e.g. trend analysis, anomaly detection) beyond what CloudWatch Logs Insights can do.
- Join With External Data: You need to join log data with other datasets (CMDB info, business events, etc.) — easy with SQL in Athena/Redshift, hard in CloudWatch Logs.
- Cost Optimization for Huge Volumes: Your log volumes are extremely large (think TBs per day). Using S3 as a cheap storage tier for logs and querying on demand can drastically reduce costs versus keeping everything hot in CloudWatch or running a giant self-managed ELK cluster.
For everyday operational needs, CloudWatch Logs Insights and real-time dashboards still handle recent data and alarms. However, S3 Tables unlock a more proactive, big-picture use of log data. Instead of deleting ‘cold’ logs or letting them rot in a vault, teams can treat logs as a rich dataset to explore for optimization opportunities, capacity planning and early warning signals. SDEs might, for example, schedule an Athena query to identify unusual spikes in user API errors over the past quarter, or use AWS Glue/Spark jobs to train a model on historical logs for anomaly detection — all made feasible by the log lake. The net result is an ops workflow that’s less about reactively grepping yesterday’s logs, and more about continuously gleaning intelligence from all your operational data.
GenAI Observability — Tracing LLM Token Usage and RAG Latency
As generative AI (GenAI) becomes part of our applications (through LLM APIs, Amazon Bedrock, etc.), observability needs to expand beyond CPU and memory. We now care about things such as token counts, model latency and prompt effectiveness. CloudWatch’s new Generative AI Observability feature (GA October 2025) gives AWS builders first-class visibility into these AI-specific metrics. It shifts GenAI monitoring from a manual effort (instrumenting every model call) to an automated, integrated experience. Whether you’re deploying LLMs via Amazon Bedrock or orchestrating complex RAG workflows with LangChain, CloudWatch can natively track the health, performance and cost of your AI services.
LLM Token Costs Under the Microscope
Most managed LLMs are billed per token, so a misbehaving prompt or runaway response can burn money quickly. CloudWatch now automatically measures token usage for your Model Invocations. In the Model Invocations dashboard, you’ll find metrics such as Total Tokens Processed, Average Tokens per Request, broken down into input tokens versus output tokens. This granularity means you can monitor not just how many requests you’re serving, but how expensive each request is in terms of tokens. For example, you might discover your average output token count spiked 2x last week, potentially indicating a prompt that is eliciting overly verbose answers (and thus higher cost). By setting up CloudWatch Alarms on these metrics (e.g. alert if average tokens per invocation exceeds a threshold), SDEs can catch cost anomalies early — before the AWS bill arrives. Moreover, CloudWatch can attribute usage and cost by application, user or even individual prompt if you tag requests, thanks to integration with Bedrock’s Application Inference Profiles and embedded metrics. The outcome is cost transparency for GenAI: Teams know exactly which feature or user segment is driving up LLM costs and can optimize accordingly (such as refining a prompt or caching certain responses).
RAG Latency and End-to-End Tracing
RAG pipelines combine an LLM with a knowledge retrieval step (e.g., querying a vector database or search index). This adds new performance considerations — for instance, a slow vector DB query can bottleneck the whole user request. CloudWatch’s GenAI observability addresses this via end-to-end tracing of prompts and agent workflows. With minimal setup, CloudWatch will capture a distributed trace that follows the flow of a GenAI request: From the initial API call, through any tool or knowledge base lookups, to the final model response. In the CloudWatch console’s GenAI trace view, you can see each segment’s latency. For example, a trace might show: ‘User query -> Agent invoked -> KnowledgeBase.search() took 120 ms -> LLM.generate() took 800 ms -> Response returned’. Out-of-the-box dashboards highlight overall model latency (average, P90, P99), so you can track customer experience. If tail latency is creeping up, the traces help pinpoint whether it’s the LLM inference time or the retrieval step (or some iterative agent loop) causing the delay. In effect, CloudWatch brings the power of AWS X-Ray to GenAI workflows, with built-in awareness of AI-specific components. An SDE can filter traces by high latency or errors and drill into, say, which queries took unusually long due to multiple tool invocations. This level of insight is crucial for optimizing RAG systems, where latency could come from multiple places (vector index size, prompt complexity, model cold starts, etc.).
Native Integration Vs. Custom Instrumentation
If you’re using Amazon Bedrock to host or call models (or its AgentToolkits like AgentCore), CloudWatch GenAI Observability works almost automatically. Bedrock emits the relevant metrics and logs, and CloudWatch organizes them into the Model Invocations and AgentCore dashboards. This includes capturing the content of prompts and responses in curated logs (with redaction for sensitive data), so you can even review what the model was asked and how it answered — useful for quality and accuracy audits. CloudWatch also supports popular open-source AI frameworks: It’s compatible with LangChain, LangGraph and the Strands Agents SDK out of the box. For example, if you use LangChain’s integration, each step in your chain (LLM call, tool call, memory lookup) can emit trace events that CloudWatch ingests and visualizes, without you writing custom code. Under the hood, this is powered by AWS Distro for OpenTelemetry (ADOT). If you’re rolling your own AI solution (say calling OpenAI’s API directly), you can still leverage CloudWatch by using OpenTelemetry SDK to instrument your code. For instance, you could count tokens from the API response and record a CloudWatch metric ModelTokensUsed on each call or create a trace span around your vector DB query. The new CloudWatch Application Insights for AI will happily ingest those, and they’ll appear alongside Bedrock’s native metrics in a unified view.
Why This Matters for SDEs
GenAI observability turns what used to be a blind spot into a source of operational intelligence. In practice, teams have started treating LLM usage as a resource to be managed — much like CPU or memory. A builder-focused workflow might include: Setting budgets and alerts on LLM usage (e.g., alert if an app uses more than $X in tokens in a day), tracking prompt performance (are new deployments causing higher token counts or error rates?) and monitoring latency versus quality trade-offs (Did that new vector index boost accuracy but also increase latency beyond our SLA?). CloudWatch’s built-in visuals and analytics for GenAI free you from implementing these monitors from scratch. A concrete example: Imagine you deploy a new version of your chatbot that uses a larger model for better answers. CloudWatch’s model dashboard immediately shows that while user satisfaction went up (perhaps measured via a custom metric or lower fallback rate), the P99 latency doubled and the average output tokens went from 200 to 500. With this insight, you might decide to refine the prompt or add caching for frequent queries to tame costs and latency. In essence, AI-driven apps require AI-aware operations, and CloudWatch is providing that in a turnkey fashion — allowing SDEs to be proactive about cost optimization and performance tuning in the ML domain just as they are with traditional infrastructure.
Automated Root Cause Analysis With AI and the Five Whys
Even with the best monitoring, incidents will happen — and when they do, pinpointing the root cause quickly is paramount. Traditionally, engineers would scramble through logs, dashboards and ticket histories to explain why an outage or alarm occurred. It’s a time-consuming, manual process that prolongs downtime and drags out postmortems. CloudWatch is changing this with AI-powered incident analysis, notably through a feature that applies the ‘five whys’ technique in an automated, interactive fashion. This approach, inspired by Amazon’s internal correction of error (COE) practice, uses a conversational AI (Amazon’s Q service) to guide engineers through iterative why-questioning until the true root causes are uncovered.
So, what is ‘five whys’? It’s a classic root cause analysis method where you start with the surface symptom and keep asking ‘Why did that happen’? — each answer leads to the next ‘why’ — usually about five times, or until you reach a fundamental cause. CloudWatch’s Incident Reports feature now includes a guided ‘five whys’ workflow that essentially automates this line of inquiry. When an incident occurs (say a high error rate in a service), you can initiate an investigation in CloudWatch, which is a GenAI-driven analysis of correlated telemetry (metrics, logs, traces, AWS CloudTrail events, etc.) around that time. The system will then propose an incident report draft and launch the ‘five whys’ chat interface. Through a Q&A style chat, it might say: “We saw 500 errors spiking at 3 a.m. due to database connection failures. Why did the database connections fail?” — and it will either use data to suggest an answer or prompt the on-call engineer for input. Perhaps you confirm that the database was out of connections. The AI then asks, “Why were there no available connections?” You dig into logs and find too many batch job opened, and didn’t close them. The chat (which retains context) continues: “Why did the batch job not close connections?” You realize error handling in that job is flawed. “Why was the error handling flawed?” It may suggest looking at code review processes, and you conclude that the coding standards didn’t catch this. Finally: “Why do we lack that check in code reviews?” The answer might be that the team wasn’t aware of this issue due to missing knowledge transfer. Through this dialogue, CloudWatch helps you traverse from a technical trigger to a deeper process or design weakness. In our hypothetical example, the root cause might be summarized as: Inadequate database connection handling in batch job due to gaps in the code review checklist, and the system would then even suggest recommended actions such as implement connection pool monitoring, update code review guidelines to include resource cleanup and add automated tests for connection leaks.
This AI-guided analysis confers several benefits. First, it ensures systematic, thorough investigation rather than a hasty scapegoating of the first obvious failure. By documenting each ‘Why’ step, it creates a transparent explanation chain that’s invaluable for knowledge sharing and future prevention. Second, it reduces MTTR dramatically. CloudWatch investigations doesn’t wait for you to piece things together; it starts crunching data as soon as an alarm or incident is declared, surfacing correlated anomalies or suspicious events. Many SDEs report that by the time they get to their desk, CloudWatch’s investigation pane has already highlighted, for example, that “90% of the errors came from service X after a deployment at 2:59 a.m.” or “latency spiked on node Y, which had an unusually high GC pause.” This cuts down the time spent simply finding where the problem originated. Then, with ‘five whys’, the team is guided to dig into the why with AI’s assistance, which keeps the process moving efficiently and not missing key angles. The result is not only faster resolution of the immediate incident, but also actionable insights to prevent it from happening again. CloudWatch’s incident report will capture the entire Q&A and the conclusions, so you have a written record for the post-incident review — essentially, the AI helps write your RCA document.
From a workflow perspective, SDEs and DevOps engineers will integrate this by triggering CloudWatch investigations automatically on critical alarms. For instance, you might configure a CloudWatch Alarm’s action to start an investigation whenever a web app’s error rate goes above threshold. By the time the on-call engineer responds, the investigation (using GenAI under the hood) might have analyzed logs, metrics and recent deployments to suggest likely causes. The engineer can then use the ‘five whys’ chat to validate those findings and fill in any gaps (the AI might ask for confirmation or additional context where data is ambiguous). It’s a collaborative human+AI process — think of it as having a knowledgeable co-pilot in your incident room. This changes the SDE’s role during incidents from ‘data miner’ to ‘decision maker’. Instead of spending the first hour of an outage gathering clues, you start with a concise set of clues and hypotheses from CloudWatch. You can focus immediately on confirming the root cause and executing the fix or mitigation, cutting mean time to recovery. One early adopter described it aptly: “CloudWatch’s AI gave me a head start — it was like coming into a broken system with an expert who had already checked the usual suspects.” After resolution, the ‘five whys’ report ensures the learnings are recorded and fed back into team practices (e.g. improving a runbook or test coverage), closing the loop on continuous improvement.
Conclusion: Proactive Ops for the Builder Generation
‘Beyond dashboards’ isn’t just a catchy title; it’s the reality of cloud operations in 2026. AWS CloudWatch’s AI-driven features are transforming observability from a reactive, eyeballs-on-glass exercise into a proactive, insights-driven discipline. For AWS builders and architects, this means your time and talent can be spent on higher-value engineering rather than firefighting or plumbing data pipelines. You can store all your telemetry without breaking the bank (thanks to log lakes on S3) and leverage it for analysis and ML. You gain deep visibility into AI workloads out of the box, ensuring that cutting-edge features such as LLMs remain cost-effective and offer high performance. When things go wrong, CloudWatch’s AI assists in diagnosing and learning from incidents faster than ever, reducing downtime and stress.
Crucially, these advances change the mindset of operations. Instead of asking “Is everything on the dashboard green today?”, teams are asking “What can our data tell us next?” and “How can we prevent the next incident?” The CloudWatch AI revolution enables an ‘operational intelligence’ approach, where the monitoring system doesn’t just collect data, but interprets it and provides actionable wisdom. SDEs can incorporate this intelligence directly into their workflows: Automated investigations feed JIRA tickets with root cause analysis, anomaly detection alarms prompt code improvements before users notice issues and cost insights from LLM usage guide architectural decisions (like fine-tuning a model or caching results). The result is higher service reliability and performance, achieved not by brute-force manual effort but by smart automation in partnership with AI.
As you adopt these CloudWatch capabilities, keep a builder’s mindset: Experiment and tailor them to your environment. Build that Athena log analysis query that runs every morning to spot weird patterns. Tag your GenAI requests with business context to get richer cost attribution. Trust the ‘five whys’ process and encourage your team to embrace it, even if it feels different from traditional postmortems. By doing so, you’ll not only solve problems faster, but also systematically harden your systems with each insight gained. The future of observability is proactive and intelligent, and it’s here now in CloudWatch — enabling us to spend less time watching dashboards and more time building the next big thing.