Modern engineering teams have invested heavily in observability. Dashboards are populated, alerts are configured, on-call rotations are set. Yet when production incidents occur, the average time to resolution hasn’t dropped nearly as fast as the tooling has improved. The reason, in many cases, comes down to one overlooked gap: logs aren’t being used the way they should be during active incidents.
This isn’t a tooling problem. Most organizations already have log data flowing somewhere. It’s a workflow problem, specifically, how logs integrate (or fail to integrate) into the broader incident response process.
The Three-Tool Problem
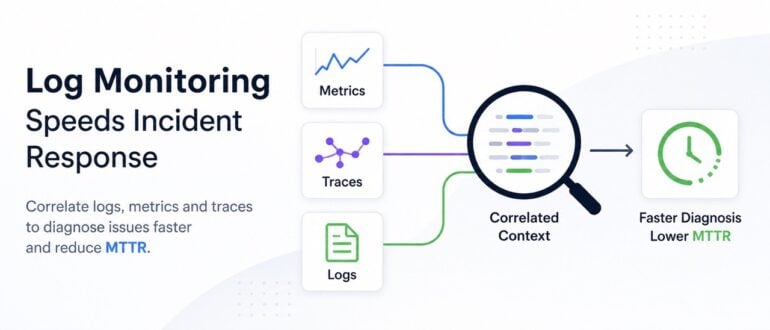
A typical incident response scenario looks something like this: an alert fires, the on-call engineer opens a metrics dashboard to understand the scope, then switches to a separate logging tool to investigate root cause, then jumps to a tracing tool to follow the request path. Three tools. Three contexts. Three sets of query syntax.
By the time the engineer has assembled enough context to diagnose the issue, significant time has already elapsed, not because the data wasn’t there, but because it wasn’t connected. According to a 2025 survey of IT and DevOps leaders, nearly one-third of organizations use five or more observability tools, and two-thirds report it takes four or more hours to resolve production issues. The correlation isn’t coincidental.
Logs as Narrative, Not Just Data
The fundamental value of logs in incident response isn’t just diagnostic; it’s narrative. Metrics tell you that something is wrong. Traces tell you where in the system the failure is propagating. Logs tell you what actually happened, line by line, at the exact moment things broke. That narrative context is irreplaceable during high-pressure incident triage.
The problem is that logs are often treated as a post-incident forensics tool rather than a real-time response asset. Teams pull logs after the fact to write postmortems, not during the incident to accelerate diagnosis. Flipping this pattern, making log data immediately accessible and correlated with other signals at the moment of detection, is one of the highest-leverage changes a team can make to their incident response workflow.
What Effective Log Integration Actually Looks Like
The shift from reactive to active log usage in incident response comes down to three practices.
First, log correlation at the point of alerting. When an alert fires, the response interface should surface relevant log events automatically, not require the engineer to open a separate tool and construct a query from memory while under pressure. Correlated log context should be part of the alert payload itself.
Second, structured logging as a standard, not an aspiration. Unstructured logs are difficult to query quickly under pressure. Teams that have invested in structured logging, consistent field names, log levels, service identifiers, and request IDs dramatically reduce the cognitive load on responding engineers. Searching for a specific request ID across services becomes a seconds-long operation rather than a minutes-long one.
Third, the right tooling for the volume and velocity of log data your system generates. Choosing and configuring log monitoring tools that can ingest, index, and surface logs in real time, rather than with a lag, is foundational. A logging platform that’s five minutes behind during a P1 incident is functionally useless for triage purposes.
The On-Call Experience Is a Product Decision
One underappreciated dimension of log monitoring in incident response is its impact on on-call engineer experience. Alert fatigue is a well-documented problem, but log fatigue, the experience of drowning in raw, unstructured, uncontextualized log data during an incident, is equally damaging and far less discussed.
When logs are well-structured, correlated with metrics and traces, and surfaced at the right moment, on-call becomes a manageable cognitive task. When logs are siloed, noisy, and queryable only through a separate interface, on-call becomes an exhausting detective exercise that degrades both resolution speed and team morale. The investment in better log monitoring isn’t just an observability decision, it’s an organizational health decision.
The OpenTelemetry Factor
The growing adoption of OpenTelemetry is quietly reshaping how teams approach log integration. As OpenTelemetry’s logging specification matures, teams are gaining a standardized way to collect, enrich, and export logs alongside traces and metrics using a single, vendor-neutral instrumentation layer. This matters for incident response because it creates the technical foundation for true correlation, logs that carry the same trace IDs as distributed traces, enabling engineers to move seamlessly between signal types during triage.
Teams that invest in OpenTelemetry-native instrumentation now are building an incident response capability that compounds in value over time as their systems grow more complex.
Closing the Loop
Incident response maturity is often measured by MTTR, mean time to resolution. But MTTR is a downstream metric. The upstream inputs that actually move it are time to detection, time to context, and time to diagnosis. Log monitoring, done well, directly compresses all three.
The teams shipping the most reliable systems aren’t necessarily the ones with the most sophisticated alerting or the most granular metrics. They’re the ones who have made log data a first-class citizen in their incident response workflow, not a fallback resource for postmortems, but an active, correlated, real-time signal that shortens the gap between something breaking and someone understanding why.
In a world where every minute of downtime carries a measurable cost, that gap is worth closing.