

If you have ever tried to keep more than a handful of Jenkins instances healthy at the same time, you already know the problem: every master drifts a little differently. Plugins fall out of sync, storage quietly fills up, one team’s “quick fix” becomes another team’s outage, and nobody has a single view of what is actually running across the organization. Multiply that by 150+ instances spread across on-premise data centers and multiple clouds, and manual administration stops being an option. That was the starting point for a project we shipped in three phases over about 20 months: a centralized UI and automation layer that gives platform teams one place to upgrade, back up, roll back, monitor and manage access for every Jenkins instance in the company — without each team having to become Jenkins administrators themselves.
Why Centralization Was Overdue
Jenkins is famously easy to stand up and famously easy to let sprawl. As the instance count grew past the point where any one person could reason about the whole fleet, a handful of recurring pain points kept surfacing: inconsistent plugin versions that broke pipelines after ad-hoc upgrades, backups that existed on some masters and not others, no unified alerting when an instance ran low on disk or memory, and job configurations — especially non-lightweight checkouts — quietly burning far more compute than they needed to. None of these problems are exotic. What made them expensive was scale: a fix that takes ten minutes on one instance takes days when it has to be repeated, inconsistently, across 150 of them.
Architecture: A Control Plane, Not a Bigger Script
Rather than writing a longer shell script, we designed the system as a proper control plane. The frontend is a React and Redux dashboard with Material-UI components, talking to a Python backend split across Flask and FastAPI for synchronous admin actions and real-time data syncing. Underneath that sits the part that does the actual work: idempotent Ansible playbooks for upgrades and backups, Kubernetes and Helm for dynamic Jenkins agent provisioning, and ArgoCD driving GitOps-style rollouts across AWS and Azure. Observability runs through Prometheus and Grafana for metrics and the ELK stack for log aggregation and alerting, so the dashboard is showing live fleet health rather than a static inventory.
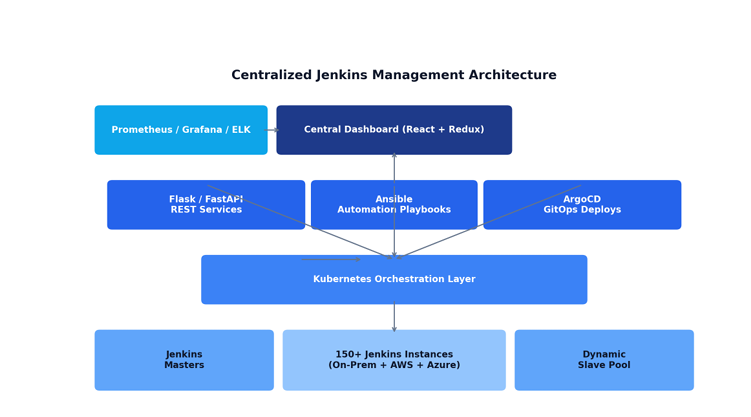
Figure 1 — The centralized control plane layered above the Jenkins fleet.
Idempotency turned out to matter more than almost anything else in the design. Because playbooks can be re-run safely, rollbacks stopped being a stressful, manual scramble and became a predictable, repeatable action — which is what let us expose a “self-service” layer to teams instead of routing every request through a platform engineer.
What the Dashboard Actually Does
● One-click upgrades and rollbacks, executed as idempotent Ansible plays across any subset of instances
● Differential backups to S3-compatible storage via rsync, scheduled centrally instead of per-instance
● Dynamic slave/agent provisioning through Kubernetes Helm charts, scaling capacity to actual job demand
● Centralized alerting for downtime, storage, CPU and memory thresholds via Prometheus and ELK
● Advanced job reporting: failed jobs, unused jobs, non-lightweight checkouts and high-resource jobs, surfaced so teams can fix their own inefficiencies
● Org-wide access management and audit logging, supporting SOC 2 and GDPR requirements
● A self-service portal so application teams can perform routine tasks without filing a platform ticket
Process and the Hard Parts
We ran this as a standard Agile delivery: bi-weekly sprints, daily stand-ups, and the usual Scrum ceremonies, starting with stakeholder interviews and Figma wireframes before any backend code was written. Integration testing simulated the full 150+ instance fleet in Docker and Kubernetes before anything touched production, and the test suite combined Jest for unit tests, Cypress for end-to-end UI coverage and Locust for load testing under concurrent fleet-wide operations. The genuinely hard problems were not the individual integrations — they were the seams between them. Keeping the dashboard’s view of fleet state synchronized in real time without introducing lag took several iterations of the polling and event model. Rollbacks needed to guarantee data consistency even mid-failure, which is what pushed us toward strictly idempotent playbooks. And because the fleet spanned on-premises hardware alongside AWS and Azure, we ended up writing custom adapters just to give every environment a consistent interface to the control plane.
Results
The clearest way to describe the payoff is in the numbers teams saw after rollout: significantly lower administrative overhead, a meaningful cut in infrastructure spend from better resource allocation and less downtime, and a large drop in time engineers spent on manual Jenkins upkeep — time that went back into actual product work.
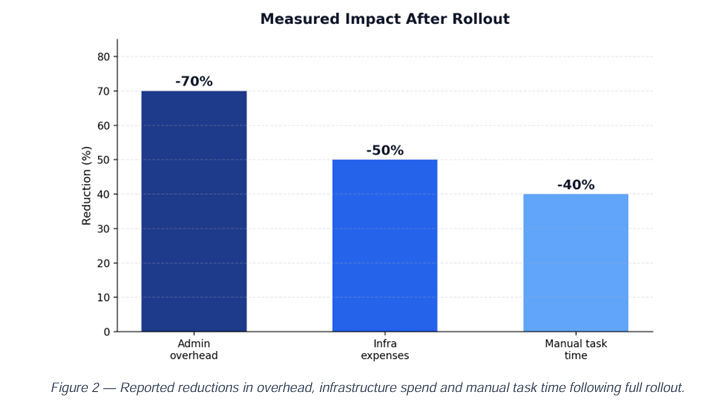
Figure 2 — Reported reductions in overhead, infrastructure spend and manual task time following full rollout.
What’s Next
This kind of fleet-wide control plane is not a novel idea on its own — there is a long history of tools for orchestrating multiple Jenkins instances. What made the difference here was combining self-service automation with genuinely actionable job reporting, so that the platform team’s job shifted from firefighting individual instances to setting guardrails the rest of the organization could operate within safely. The next phase looks at predictive resource scaling and extending the same self-service model to non-Jenkins CI/CD tooling as the organization’s pipeline mix diversifies.