In a previous post
we introduced the
Microsoft Binlog MCP Server and showed how an AI assistant can investigate
MSBuild binary logs through natural language. Picture the payoff in CI: a pull
request build fails, and instead of a human downloading the binlog and scrolling
the Structured Log Viewer, an agent opens it, pinpoints the failing target and
task, and posts the root cause straight back to the PR.
That first post was a great start, but it told only part of the story. It
highlighted 15 tools – the server’s surface has since grown well beyond that –
and it focused on the interactive, sit-at-your-keyboard experience. In practice,
the same Model Context Protocol
(MCP) tools are doing real work unattended, inside a continuous integration
pipeline on GitHub Actions.
This post fills in the rest. We’ll:
- Watch those tools run unattended inside a GitHub Actions workflow on the
publicmicrosoft/testfxrepository – a
real PR build failure, analyzed and explained automatically - Walk through the 23 Binlog MCP tools the first post never mentioned
- Back the efficiency claims with evaluation data instead of vibes
If you lead a team, here is the outcome that matters: red builds get a
plain-language root cause posted to the PR automatically, so engineers stop
losing time downloading logs and decoding MSBuild output. That means faster PR
turnaround, fewer interruptions for your build experts, and junior developers
who can unblock themselves instead of waiting for someone who “knows the build.”
And because it runs as advisory automation on infrastructure you already have,
your team can adopt it without changing how anyone works.
MCP in a GitHub Actions Workflow
Start with the payoff. The
microsoft/testfx repository runs MCP-powered agents directly in CI using
GitHub Agentic Workflows (gh aw), where
each workflow is authored in Markdown and compiled to a .lock.yml file. The
workflows are public, so you can read the exact source:
build-failure-analysis.md,
its on-demand companion
build-failure-analysis-command.md,
and the
build-failure-analyst agent
they delegate to. GitHub Agentic Workflows are still evolving, so treat these as
a reference implementation to copy from rather than a turnkey feature every
repository has today.
Build failure analysis, on every PR
The build-failure-analysis workflow runs the repository build on every pull
request, and only when the build fails wakes up an agent that queries the
binlog live through the Binlog MCP Server. The MCP server runs as a container,
with the binlog mounted read-only:
mcp-servers:
  binlog-mcp:
    container: "mcr.microsoft.com/dotnet-buildtools/prereqs:azurelinux-3.0-binlog-mcp-amd64"
    mounts:
      - "/tmp/build.binlog:/data/build.binlog:ro"
    allowed: ["*"]
The workflow spells out its own flow: it runs
./build.sh --binaryLog, and on failure “delegates to the
build-failure-analyst agent (which queries the binlog live via the
containerized binlog-mcp MCP server) to identify root causes, post a PR
comment summarizing them, and attach inline suggestion blocks tied to the
diff.” It is explicitly advisory, not gating: the agent’s comment never
decides whether the PR passes. The repository’s normal required build workflow
stays the merge gate; this MCP-powered workflow only analyzes failures and
comments on the PR.
A companion build-failure-analysis-command workflow lets a maintainer rerun
the same analysis on demand by commenting /analyze-build-failure.
Concretely, a single failed-build run might have the agent call
binlog_overview to see the build failed, binlog_errors to get the failing
error with its target and task context, and binlog_target_reasons or
binlog_task_details to explain why that step ran the way it did – then
summarize the root cause in a PR comment with an inline suggestion. That whole
chain happens without anyone opening a log viewer.
Here is an actual comment the workflow left on a microsoft/testfx pull
request. This is a real CI failure – not a hand-picked toy example, but a
formatting (IDE0055) failure in a full multi-project build – showing the same
tools at work in a real repository, posting the root
cause, the exact file and line, a ready-to-apply fix, and a build overview
pulled straight from the binlog:
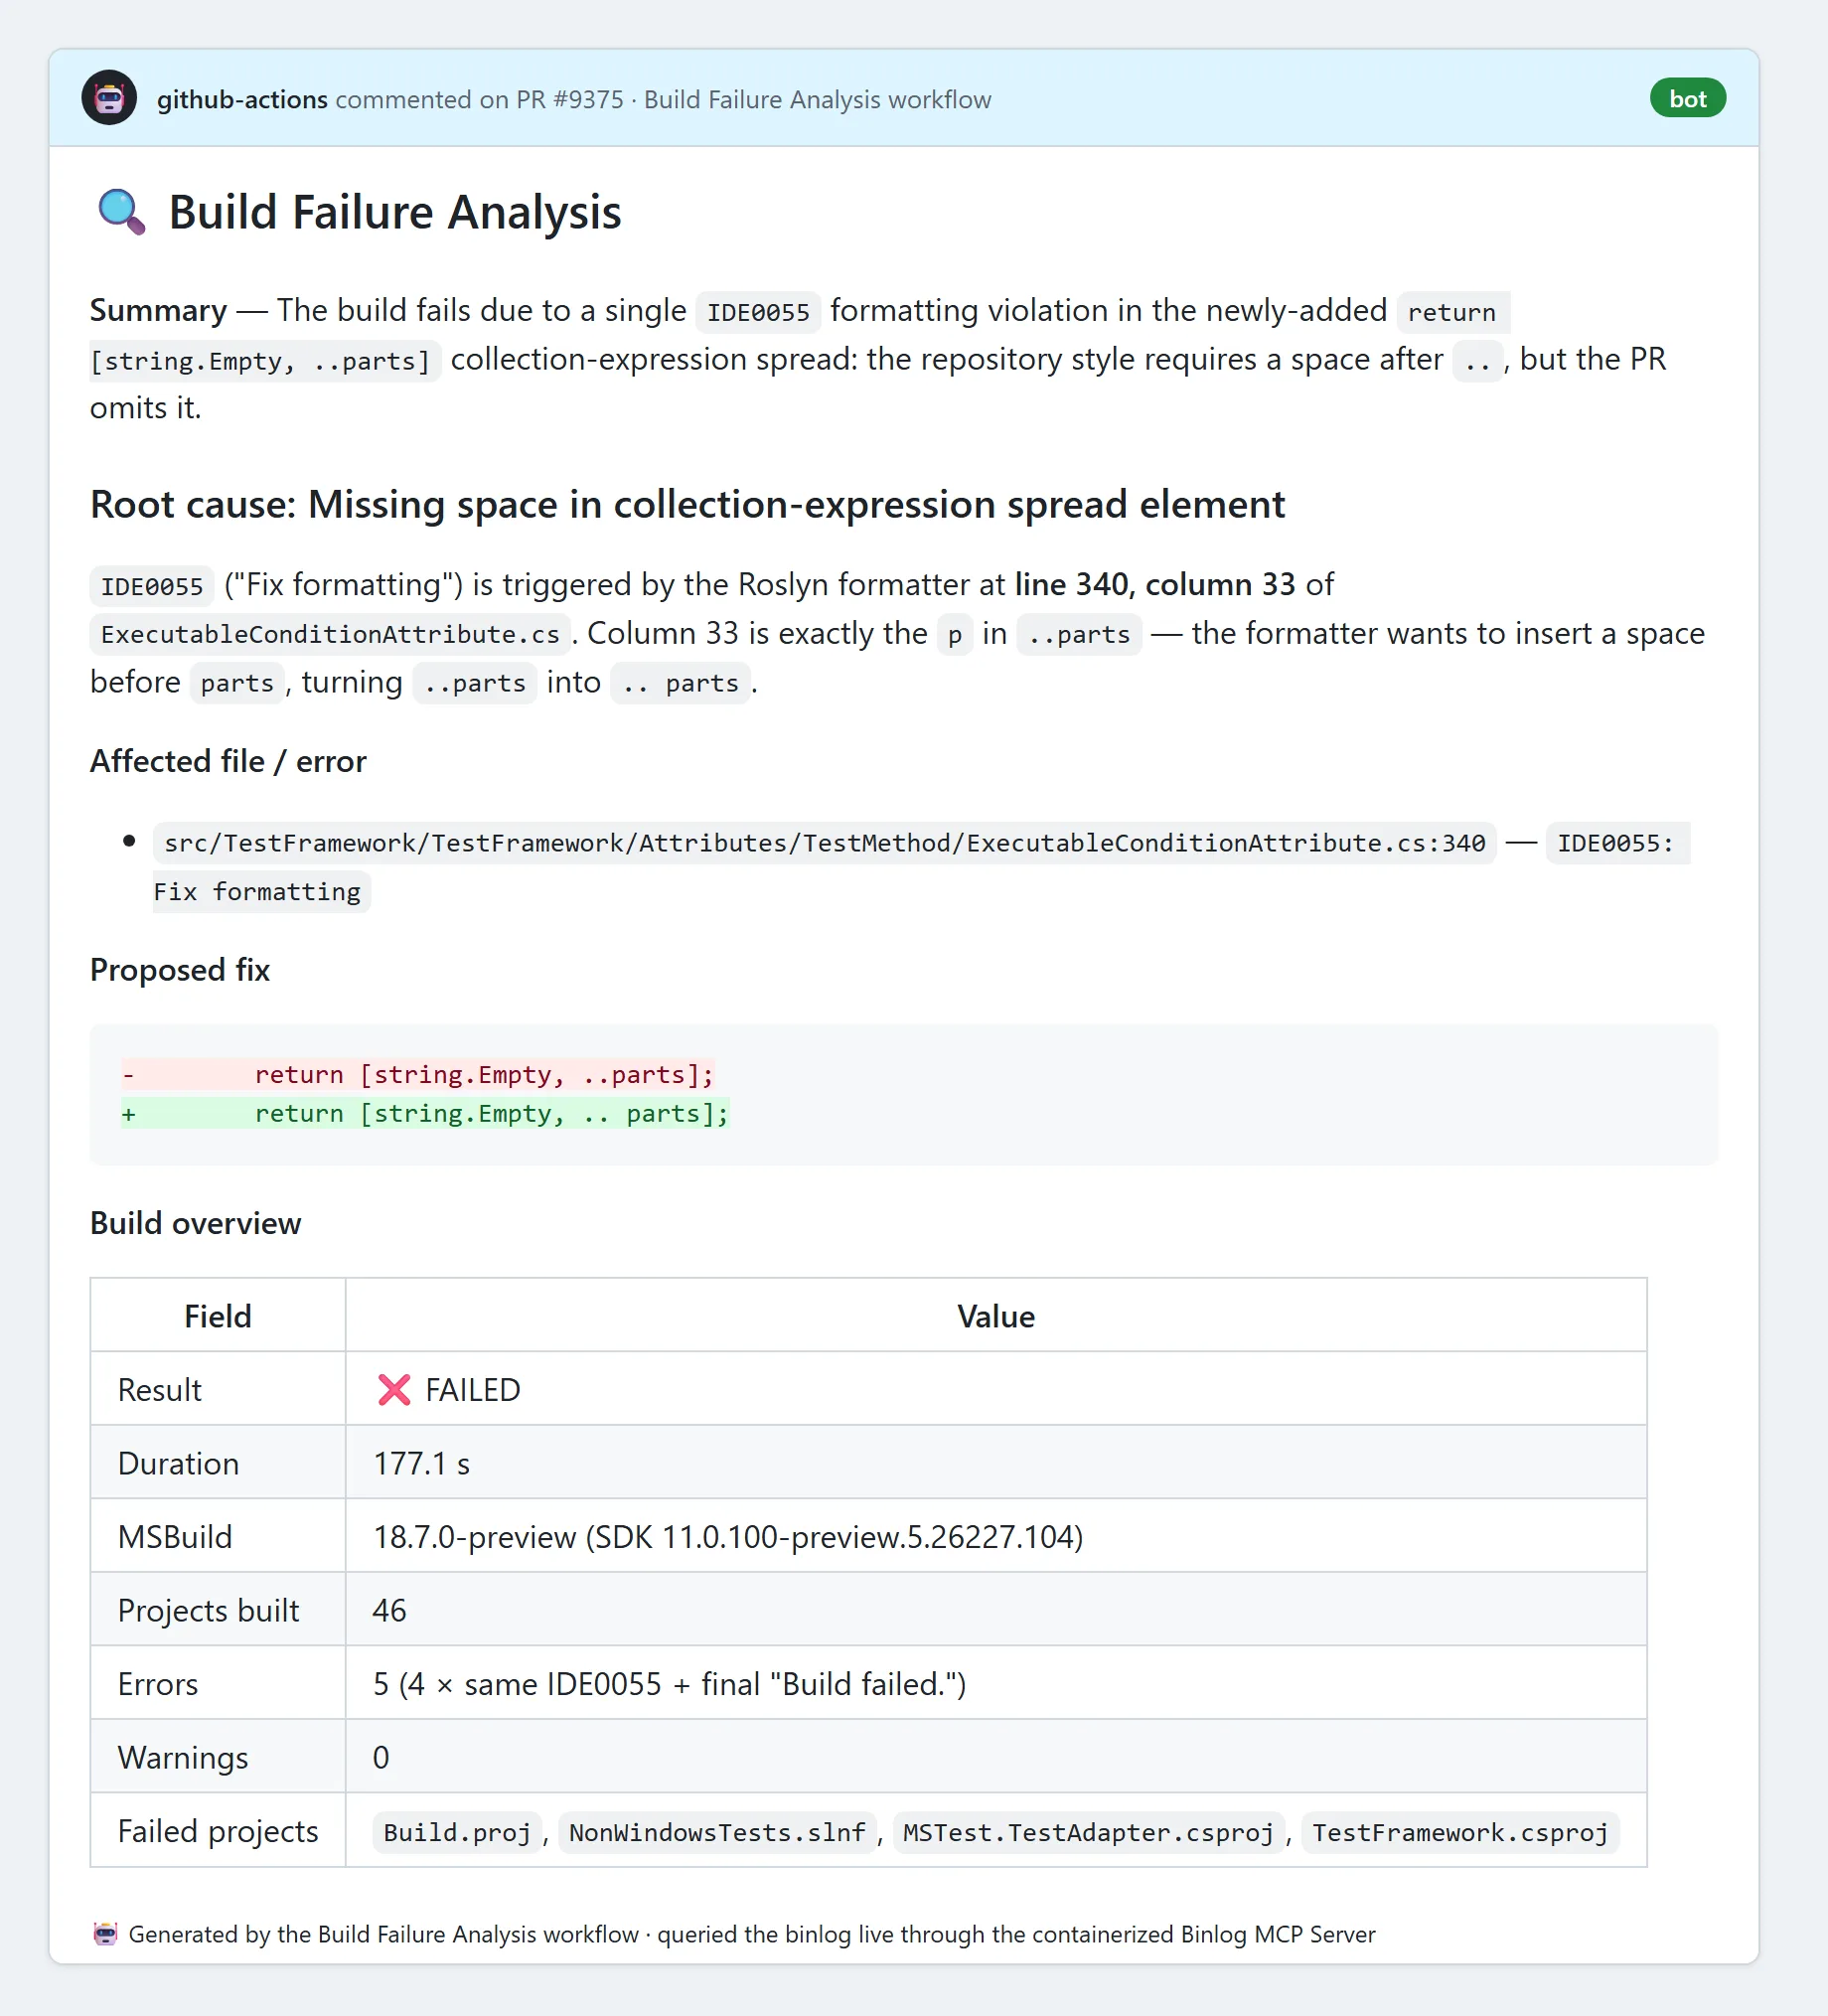
Look at what is in that comment: the MSBuild version, the 46 projects that built,
the five errors, the four failing projects, and the precise IDE0055 location
down to the column. All of it came from the agent querying the binlog live
through the containerized Binlog MCP Server – nobody downloaded a log or opened
a viewer. When the binlog can’t be parsed, the same comment degrades gracefully
to a short status note with a link back to the run, so you always know what
happened.
See the Tools in Action
You just saw those tools deliver a verdict inside CI. Now let’s slow down and
look at what a few of them actually hand back, up close. Everything below is
unedited output, captured against a tiny console app built with
dotnet build /bl.
Diagnosing a failing build
The app has a one-character typo – Consolee.WriteLine instead of
Console.WriteLine – so dotnet build fails with CS0103:
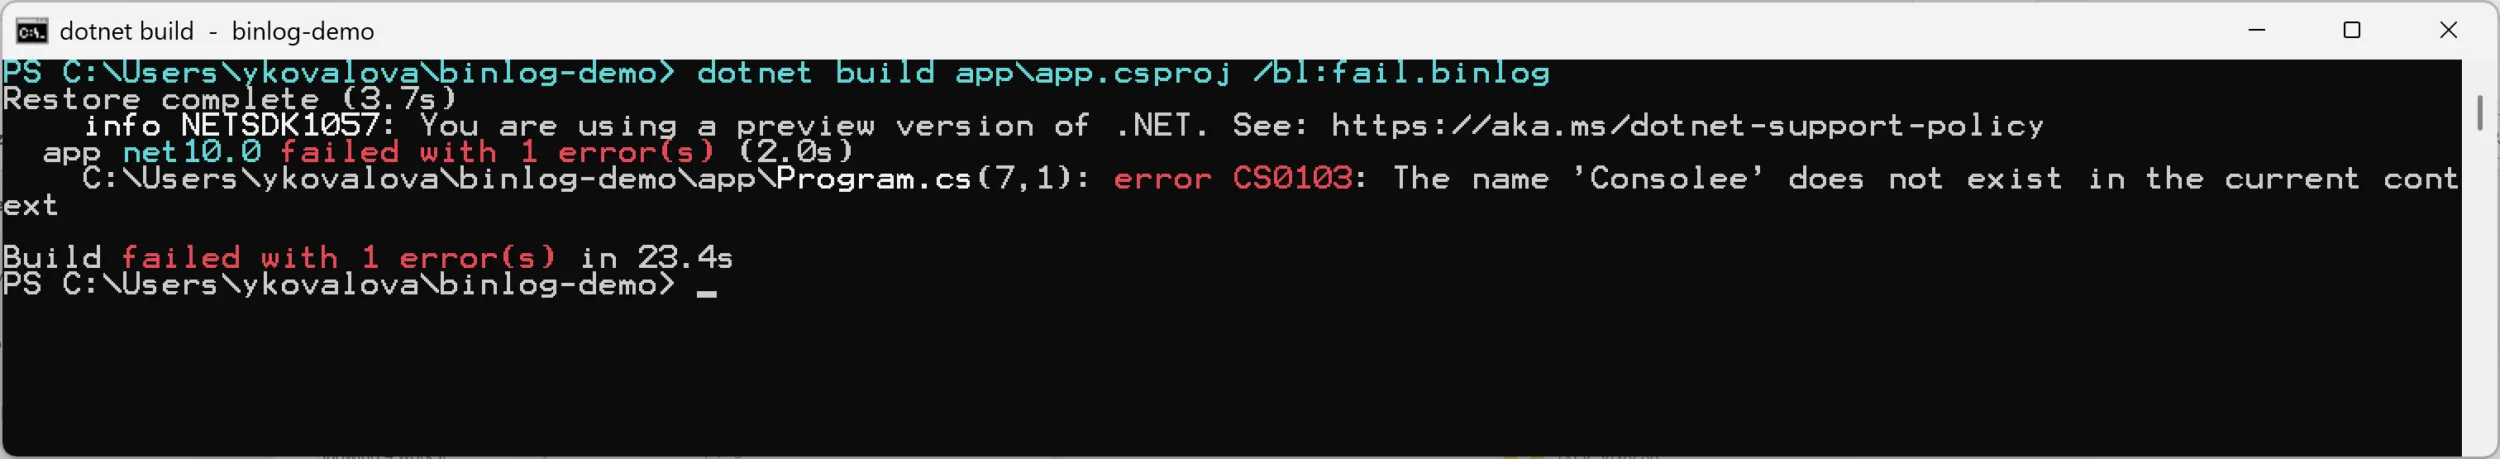
Because we built with /bl, that same failure also produced a binlog. Point an
assistant at it and it walks the path a human would, only faster:
binlog_overview to confirm the build failed and where, then binlog_errors
for the exact file, line, target, and task. Here is a real session against the
live server:
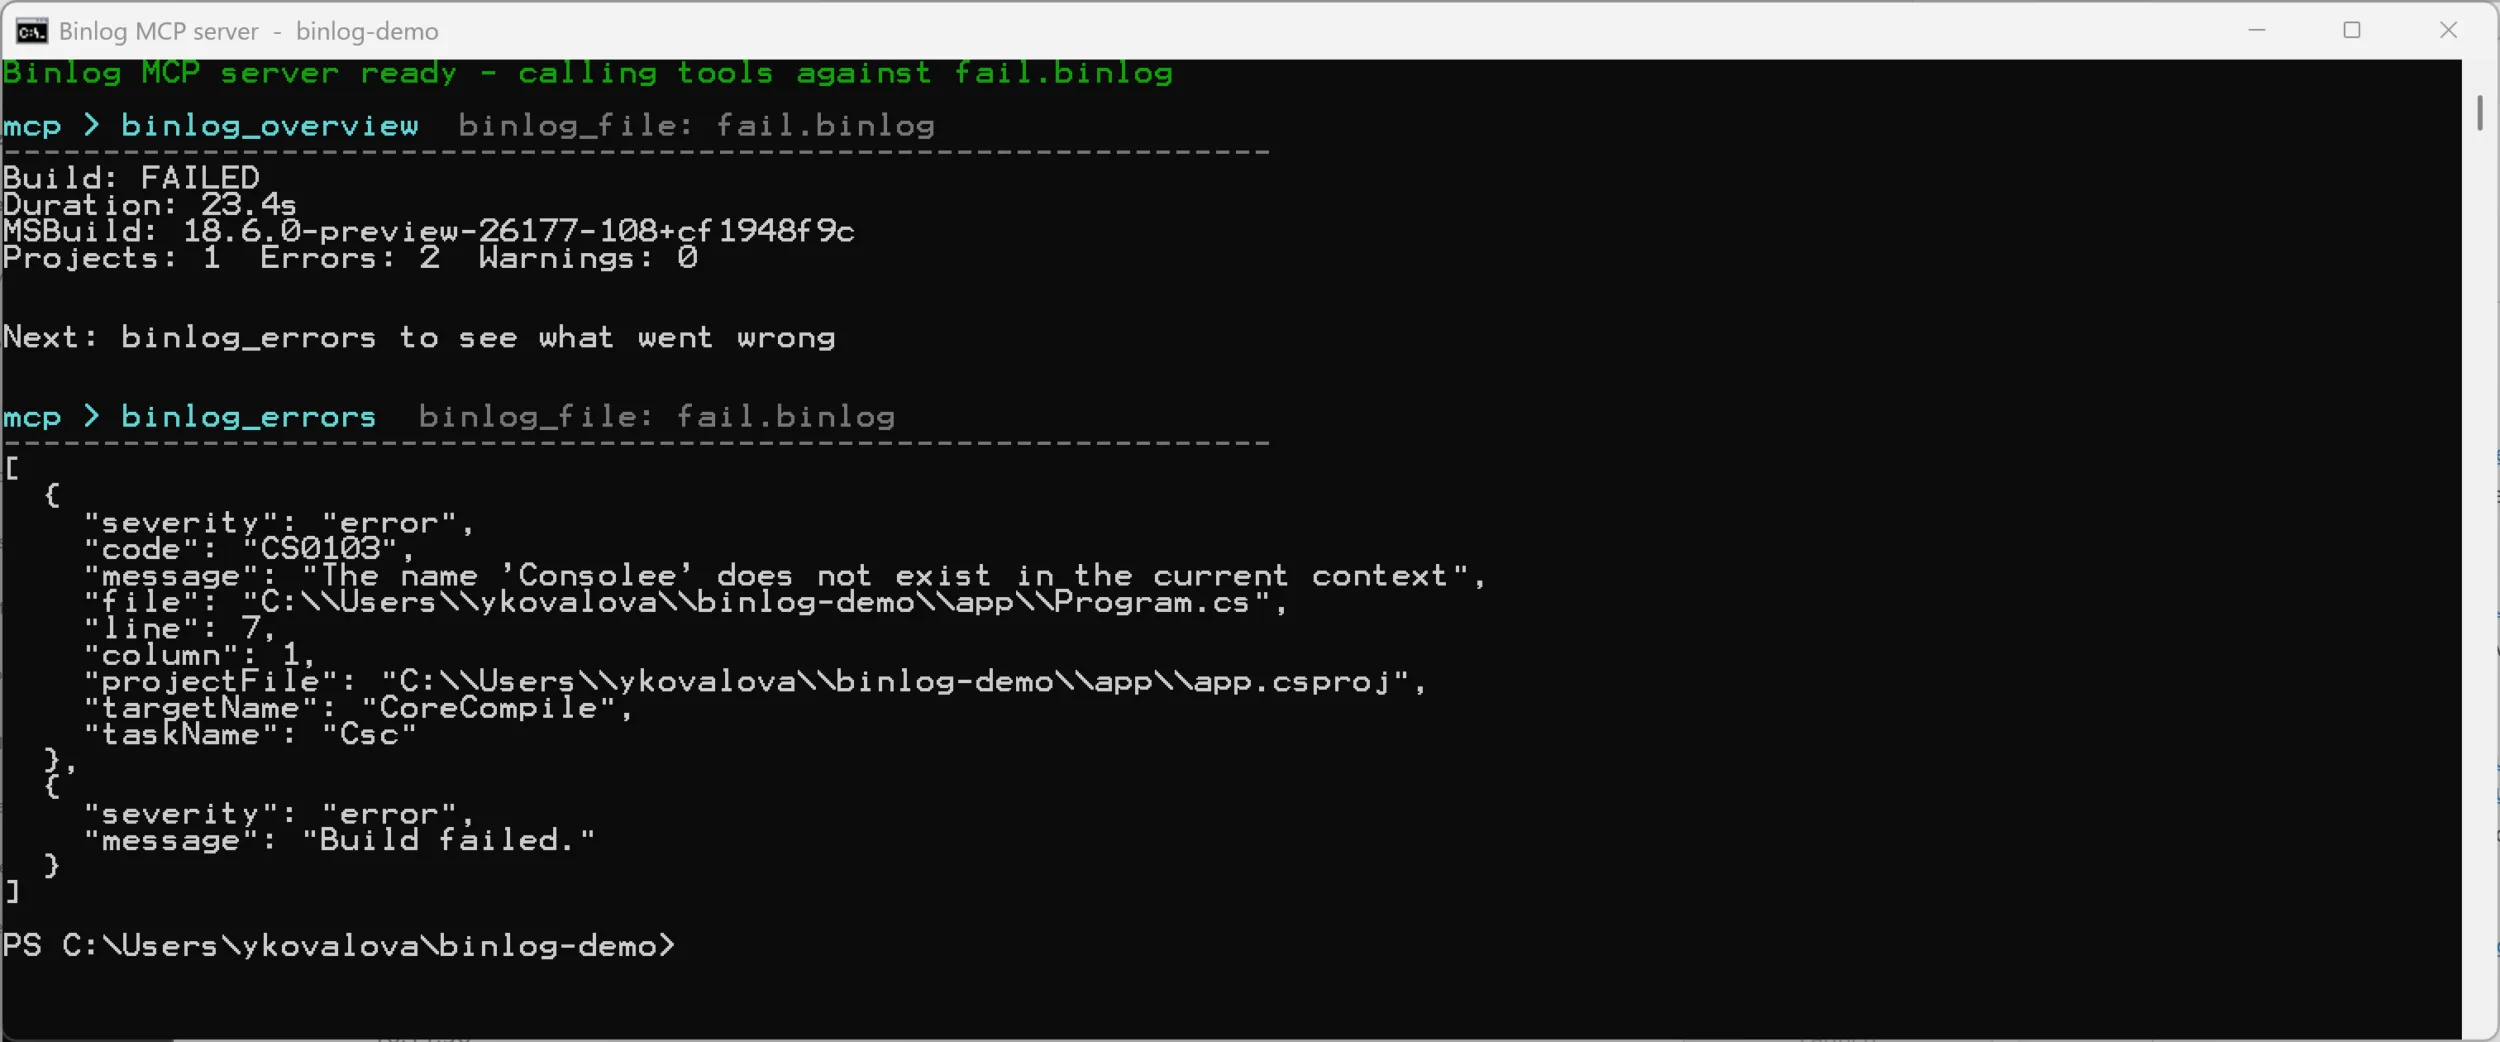
That structured payload – code, file, line, targetName, taskName – is
exactly what lets an assistant explain the failure and propose a fix without
ever scrolling a raw log.
Letting the server take the first pass
You don’t have to drive the tools one at a time, either. binlog_diagnose
does the first pass for you – it reads the binlog, groups the errors, picks
out the root cause, and even suggests a fix:
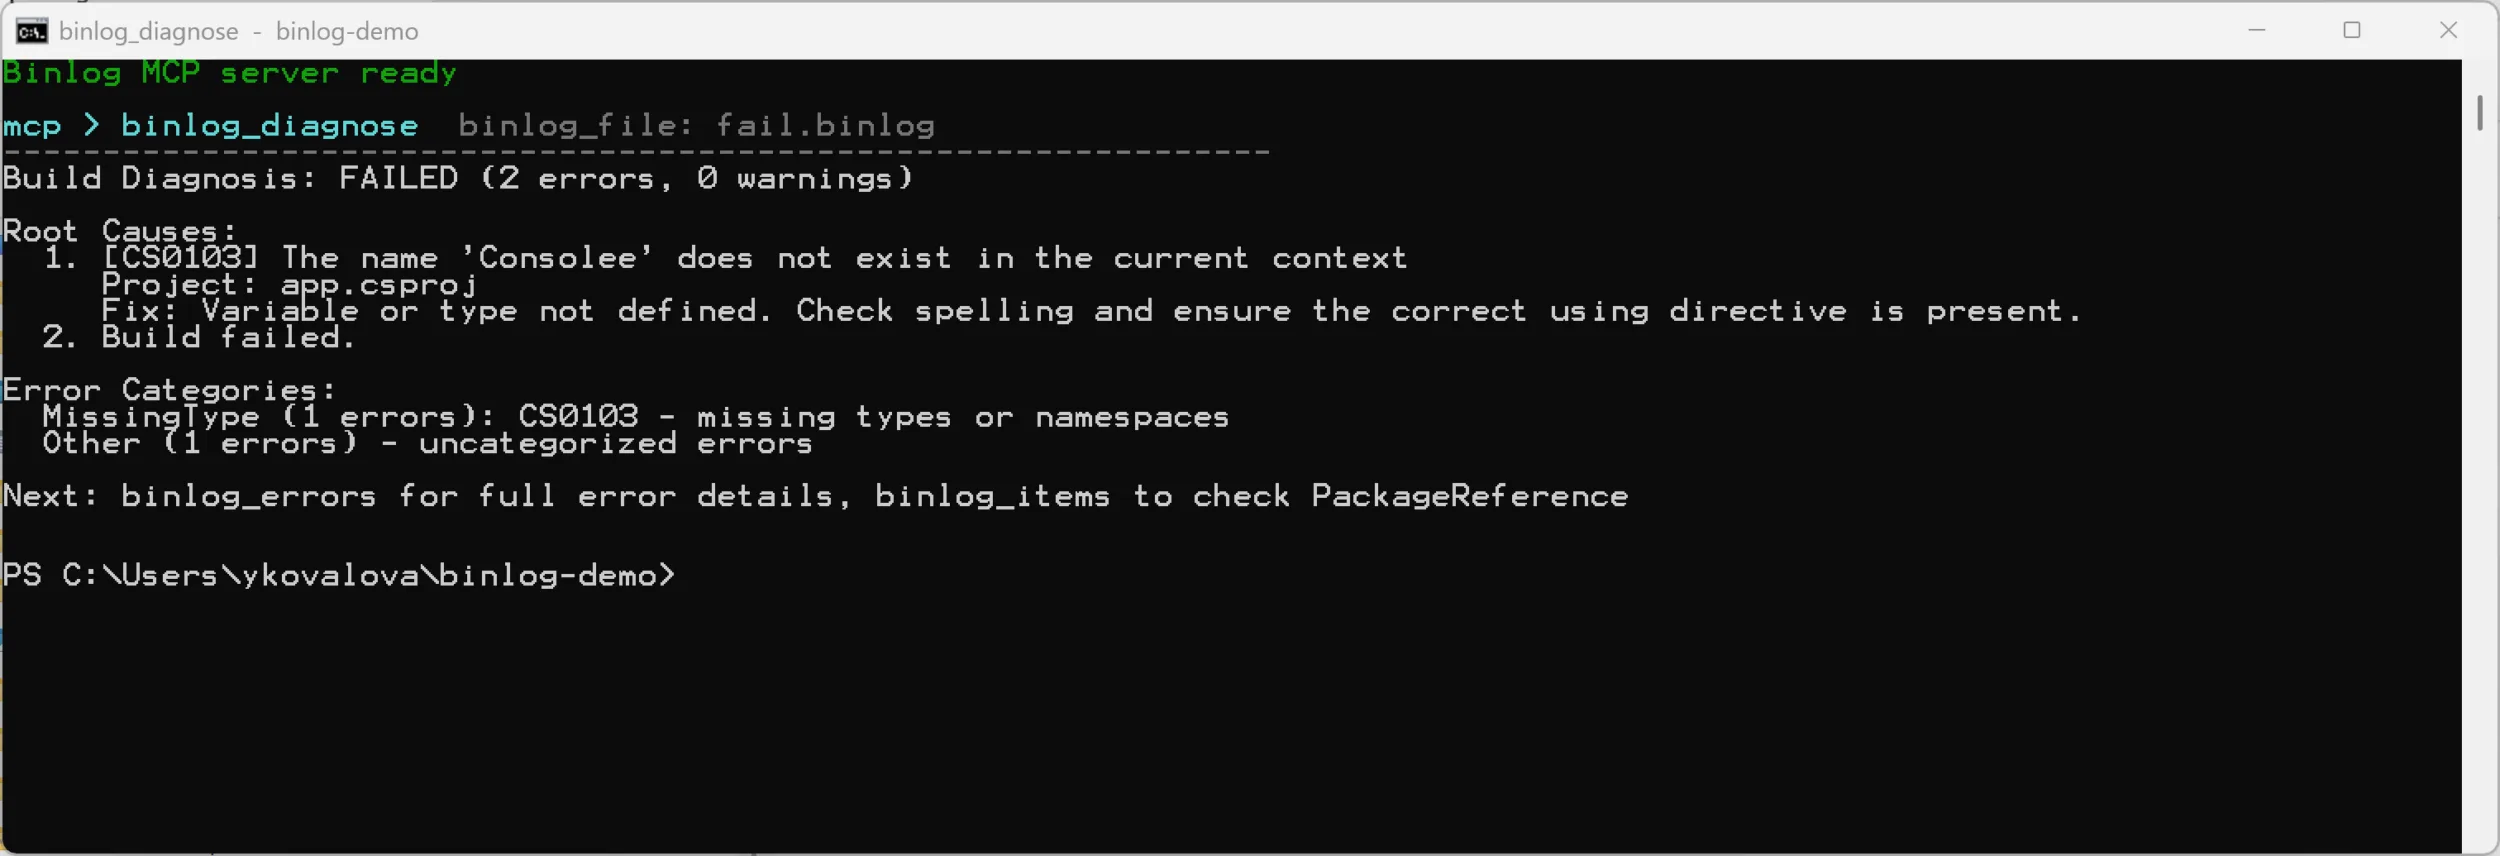
For a one-character typo that is overkill. But on a real CI failure with a
wall of cascading errors, having the server name the root cause up front –
and point you at the next tool to run – is the difference between a two-minute
fix and a half-hour log dive.
Comparing two builds
Now take two successful builds of the same project that differ only in a
project setting and an added package, and ask binlog_compare to diff them.
This is the unedited output:
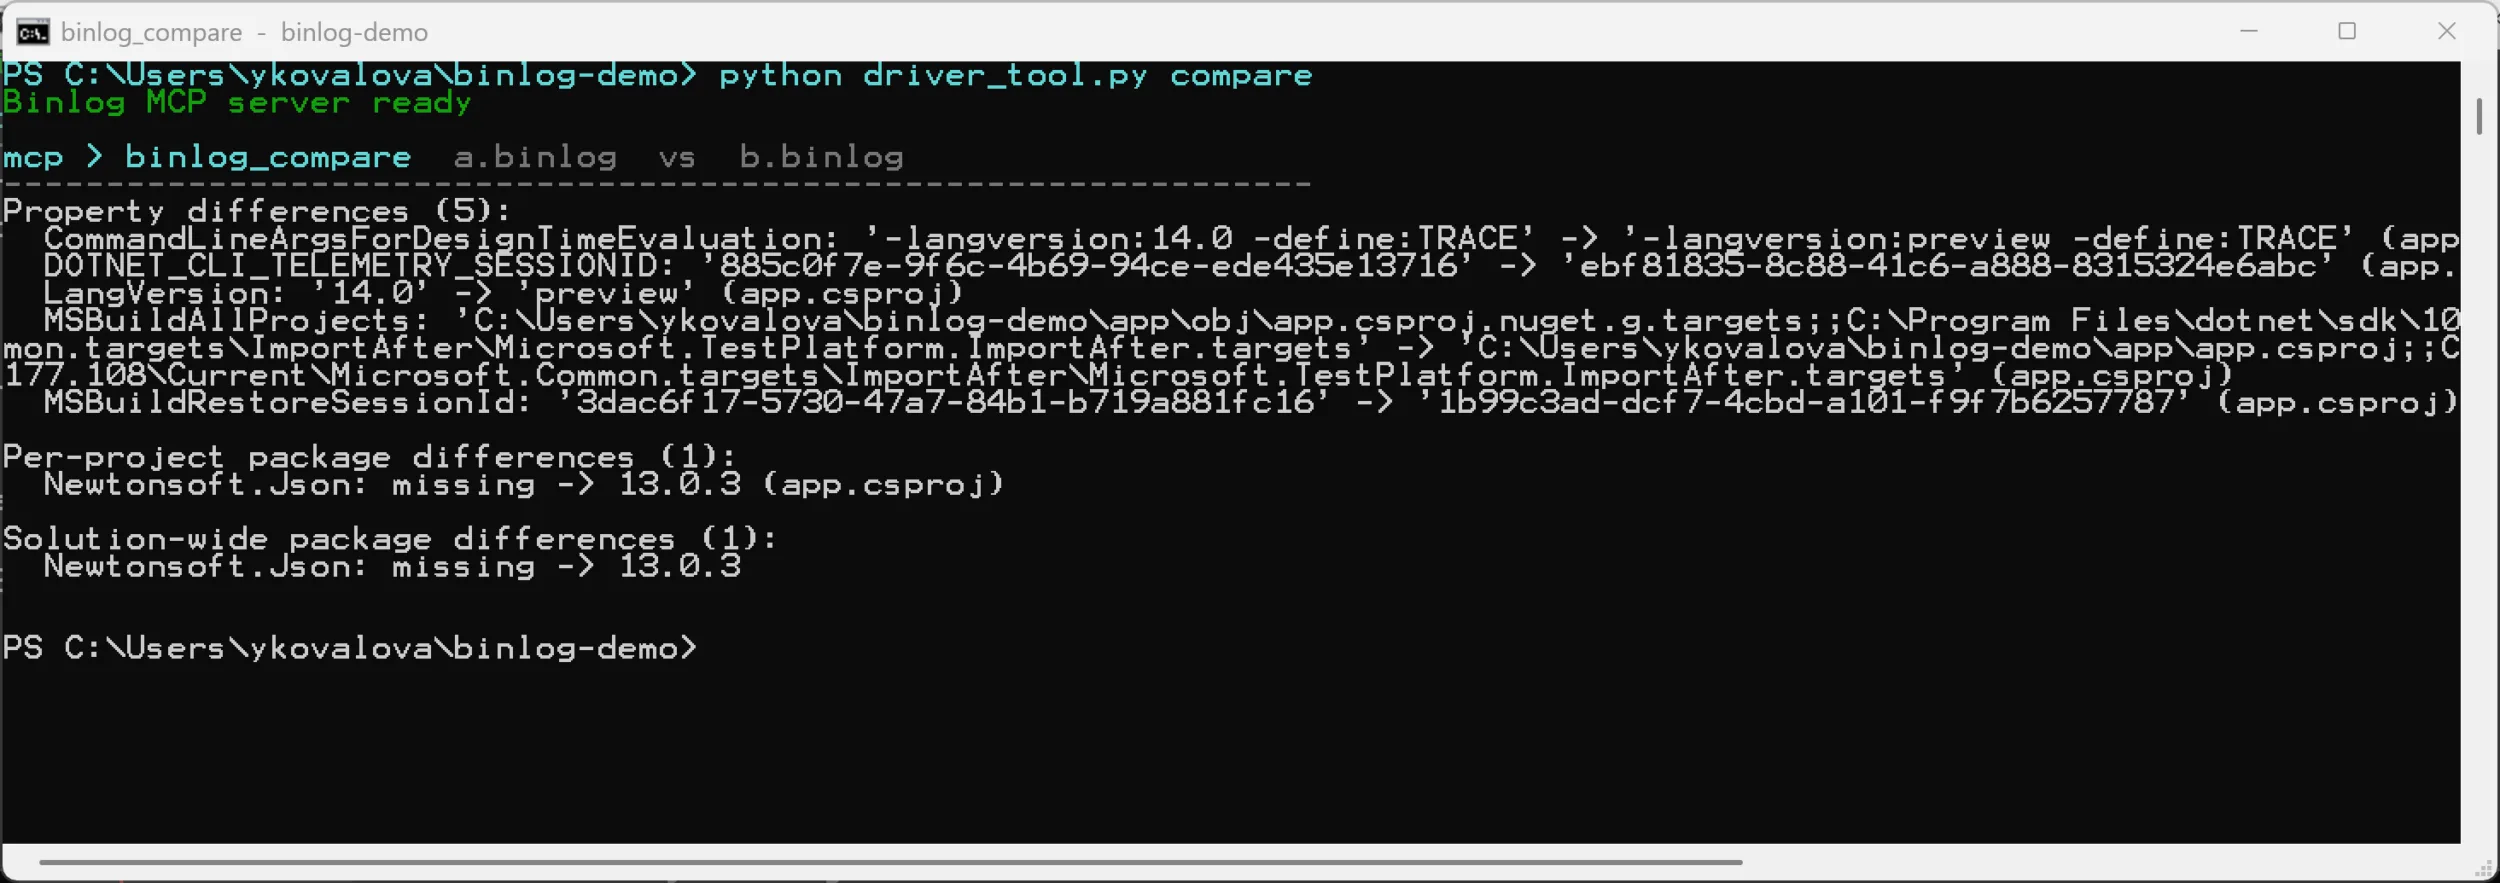
The two changes that matter jump right out: LangVersion went from 14.0 to
preview, and a Newtonsoft.Json 13.0.3 reference appeared. The rest – the
telemetry session IDs and the restore session GUID – is expected per-run
noise. Surfacing everything in one structured call is exactly what lets an
assistant separate the signal from it, instead of opening two logs and
comparing them by hand. (binlog_compare was one of the original 15 tools from
the first post, so you won’t see it in the catalog tables below – those list
only the 23 the first post didn’t cover.)
The Tools the First Post Didn’t Cover
You have now seen a handful of these tools at work, both interactively and in
CI. Here is the full set the first post skipped. The first post highlighted 15
tools for interactive investigation. As of this
writing the server source tree exposes *38 `binlog_tools** in total - so the tables below list the **23 tools the first post didn't mention**, grouped by what you use them for. (The exact set evolves, and the published container image can lag the source tree, so treat this as the current snapshot rather than a frozen contract -binlog_capabilities` always reports what your installed server
actually supports.)
Targets and tasks
When a build does something you didn’t expect – a target fires that shouldn’t,
or one you need gets skipped – these walk the execution tree for you, no
/v:diag log-diving required.
| Tool | What it does |
|---|---|
binlog_project_targets |
List the targets executed in a specific project |
binlog_search_targets |
Search targets by name across all projects |
binlog_target_reasons |
Explain why a target ran or was skipped – the usual answer to “why does this rebuild every time?” |
binlog_tasks_in_target |
List the tasks within a target |
binlog_task_details |
Details for a specific task execution |
binlog_explore_node |
Explore an arbitrary node in the build tree |
binlog_diagnose |
Automated, high-level build diagnosis – a good first stop that points at the likely culprit |
Properties and evaluation
MSBuild evaluation is where most “works on my machine” mysteries hide. These
expose the exact properties – and global properties – each project was
evaluated with, so you can compare a CI agent against your laptop.
| Tool | What it does |
|---|---|
binlog_compare_property |
Compare a single property across two binlogs – pinpoint the one setting that drifted |
binlog_preprocess |
Preprocessed project view (the msbuild /pp equivalent) – the fully expanded project after every import |
binlog_evaluations |
List project evaluations |
binlog_evaluation_properties |
Properties for a specific evaluation |
binlog_evaluation_global_properties |
Global properties for a specific evaluation |
Performance analysis
Reach for these when the build works but is slow. They turn a binlog into a
ranked list of where the time actually went.
| Tool | What it does |
|---|---|
binlog_expensive_analyzers |
Slowest Roslyn analyzers and source generators – the usual suspects behind slow compiles |
binlog_analyzer_summary |
Analyzer execution summary |
binlog_project_target_times |
Target-level timing breakdown for a specific project |
binlog_incremental_analysis |
Which targets were skipped vs rebuilt – how you catch a broken incremental build |
Graph, dependencies, and toolchain
These answer the “how is everything wired together?” questions – build order,
restore, and the assemblies that actually made it onto the compiler command
line.
| Tool | What it does |
|---|---|
binlog_build_graph |
Project dependency graph and critical path – what’s really gating your build time |
binlog_target_graph |
Executed-target timeline for one evaluation |
binlog_nuget |
Restore info: versions, sources, duration |
binlog_assembly_conflicts |
Assembly version conflict / RAR analysis |
binlog_compiler |
Compiler command-line invocations |
binlog_double_writes |
Files written by more than one task or target – a classic source of flaky, nondeterministic builds |
Contract
One housekeeping tool that keeps the others honest across server versions.
| Tool | What it does |
|---|---|
binlog_capabilities |
Report the server’s contract version and tool envelope |
That is a lot of heavy diagnostic lifting the first post never touched – whole
new capabilities like automated diagnosis (binlog_diagnose), per-evaluation
inspection for multi-targeted builds, dependency and critical-path graphs,
NuGet restore analysis, assembly-conflict detection, and incremental-build
introspection.
Tip
To generate a binary log, add /bl to any
dotnet build, dotnet test, or dotnet pack command – for example
dotnet build /bl.
Does It Actually Help? The Evaluation Data
Adding tools to an AI assistant is only worthwhile if it makes the assistant
better and cheaper, not just busier. To measure that, the team runs a public
evaluation harness that scores different configurations on the same set of
real-world MSBuild diagnosis scenarios – identifying a build failure, tracing a
property, doing a full autonomous root-cause investigation – on a 0-5 quality
scale, while recording wall-clock time, tool calls, and token usage. The results
are published at the
binlog evals dashboard.
Across the 102 runs available at the time of writing, the picture is consistent.
The dashboard includes several experimental and alternative configurations; the
table below selects the no-tools baseline plus the two configurations this post
is about. Input tokens roughly track compute cost, so on that column lower is
cheaper. Results vary by run and scenario, so check the dashboard for the full
comparison.
| Configuration | Avg score (0-5) | Avg wall time | Avg input tokens |
|---|---|---|---|
plain (no tools) |
3.25 | 349.8 s | 1,268,501 |
binlog-mcp (Binlog MCP Server) |
3.68 | 196.1 s | 1,141,426 |
skill-mcp (skills + MCP) |
3.60 | 166.7 s | 879,205 |
In other words, against the no-tools baseline the Binlog MCP Server raised the
average score from 3.25 to 3.68 while finishing roughly 44% faster
(196 s vs 350 s). The skills-plus-MCP configuration was the fastest and cheapest
of the three – about 52% faster and roughly 30% fewer input tokens than
baseline – while scoring 3.60, just below Binlog MCP alone but still well
above the no-tools baseline. One likely reason both tool-based configurations
come out ahead is that purpose-built tools let the model query structured binlog
data directly instead of reconstructing it from raw text logs, so it spends
fewer turns and tokens to reach the same answer.
About the numbers
These figures come from a preview
evaluation harness over a small, evolving set of scenarios; the dashboard flags
runs with incomplete data. Treat them as directional evidence of the efficiency
trend, not as a benchmark guarantee. Re-check the live dashboard for the latest
results.
Try It Yourself
Everything above is built on the same foundation you can adopt today:
- Install the
dotnet-msbuildplugin from the
dotnet/skills marketplace in Visual
Studio, VS Code, or the Copilot CLI. (That is the build-diagnostics plugin
this post uses; the marketplace has others for different jobs.) - Build with
/blto capture a binlog, then ask your assistant to investigate
it – now with the full toolset, not just the original 15. - To take it into CI, follow the
microsoft/testfxpattern: wire the
containerized Binlog MCP Server into a GitHub Agentic Workflow so build
failures get analyzed automatically. (These agentic workflows are still
evolving; the testfx workflows are the public reference to copy from.)
The Model Context Protocol turns out to be far more than a chat convenience. It
is a portable contract that lets the same diagnostic tools
run wherever your code does – in your editor, in your terminal, and in your
pipelines. We’d love your feedback; file issues in the
dotnet/skills repository.
The post MCP Beyond the Chat Window: Build Diagnostics in CI appeared first on .NET Blog.