
There’s a pattern playing out across engineering teams right now that nobody talks about openly: the tool meant to reduce operational complexity has quietly become one of the biggest line items on the infrastructure budget.
Observability spending is out of control, and for most teams, it’s not because they’re monitoring too much. It’s because they’re paying for platforms designed for enterprises ten times their size, ingesting data they’ll never query, and running three or four disconnected tools that still don’t give them a single coherent picture of what’s happening in production.
This isn’t a niche problem. It’s one of the defining operational challenges of 2026.
The Hidden Cost of “Industry Standard” Tooling
For the better part of a decade, the default answer to observability was to pick whichever platform the largest companies were using and figure out the budget later. That logic made some sense when infrastructure was simpler, and telemetry volumes were lower.
It doesn’t hold up today.
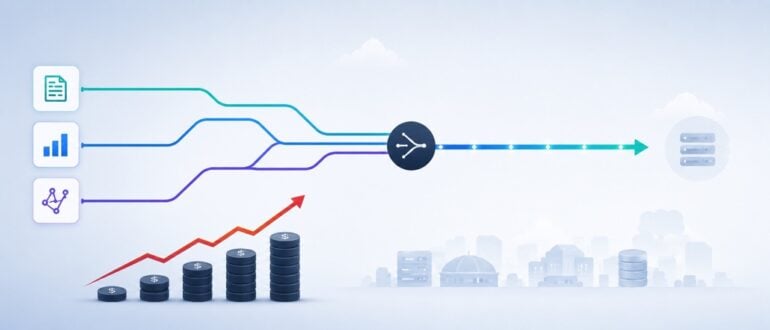
The average engineering team running Kubernetes across even a modest multi-cloud setup can generate millions of log lines and spans per hour. At per-GB or per-host pricing models used by most legacy observability vendors, that volume compounds fast. Teams report seeing observability bills balloon by 3–4x within 18 months of scaling, often without a corresponding increase in actual insight.
Worse, the cost isn’t just financial. Sprawling observability stacks, where metrics live in one tool, logs in another, and traces in a third, create a cognitive tax on every engineer doing incident response. When an alert fires at 2 a.m., the last thing you want is to pivot between four dashboards trying to correlate what went wrong.
Fragmentation Is the Real Bottleneck
The conversation about observability in 2026 has shifted from “are you monitoring?” to “can your team actually use what you’re monitoring?”
That distinction matters. Most teams have plenty of data. What they lack is context, the ability to move from a spike in error rates to the relevant trace, to the exact log lines, to the infrastructure event that caused it, all within a single workflow and without switching tools.
This is where the architecture of your observability platform becomes a first-class engineering decision, not just a vendor procurement choice.
Platforms built on a unified data model, where logs, metrics, and traces share the same underlying pipeline and correlation layer, fundamentally change what on-call looks like. Engineers stop triaging across disconnected dashboards and start investigating. Mean time to resolution drops not because the engineers got faster, but because the tool stopped slowing them down.
OpenTelemetry Changed the Calculus
One shift that’s genuinely reshaping the observability market is the maturation of OpenTelemetry as a standard. In 2026, OTel is no longer an aspirational project; it’s production-grade, widely supported, and increasingly the default instrumentation choice for teams building on Kubernetes, serverless, and distributed microservice architectures.
What OpenTelemetry means in practice: your telemetry data is no longer hostage to a single vendor’s SDK. You can instrument once and route data wherever you want. This is eroding one of the biggest switching-cost advantages legacy observability platforms relied on.
For engineering teams, the practical implication is significant. You can now evaluate observability platforms on the merits of their analysis, visualization, and alerting capabilities, not on how deeply their agents are embedded in your codebase.
What Modern Teams Are Actually Looking For
Conversations with SRE and platform engineering teams consistently surface the same set of priorities when they’re evaluating or re-evaluating their observability stack:
Unified telemetry correlation. Not just ingesting logs, metrics, and traces separately, but correlating them automatically so that moving from a failed deployment to its root cause takes minutes, not an hour of cross-tool investigation.
Predictable pricing. Per-host or flat-rate models that don’t punish growth. Teams that are scaling fast can’t afford a billing model where every new service or container spikes the observability bill unpredictably.
Fast time-to-value. Setup overhead is a real concern, especially for teams without dedicated platform engineers. Platforms that can be fully instrumented in under an hour, with out-of-the-box dashboards for Kubernetes, Docker, and common cloud services, reduce the operational friction of getting observability right from the start.
Infrastructure-aware alerting. Alerts that understand topology, that a pod restart in a specific namespace is related to a database timeout, which connects to a configuration change pushed 20 minutes ago, dramatically reduce alert noise and the cognitive load on whoever is on call.
A Practical Framework for Evaluating Your Stack
If you’re reviewing your observability setup right now, here are the questions worth asking before renewing a contract or adopting something new:
Does your current platform consolidate logs, metrics, and traces into a single interface, or are your engineers still switching between tools during incidents?
How does your observability bill scale with infrastructure growth? If doubling your container count doubles your bill, that’s worth modeling out.
What does your average setup time look like for a new service? If it takes more than a day to get meaningful visibility into a new microservice, the instrumentation burden is too high.
Are you paying for features your team doesn’t use? Enterprise observability platforms are often bought for capabilities that never get deployed: SIEM integrations, compliance dashboards and ML anomaly detection that require weeks of baseline tuning before they’re useful.
The Emergence of Developer-First Observability
One of the more interesting market developments of the past 18 months is the rise of platforms built specifically for the engineering teams doing the work, not for the security operations center or the compliance team.
Middleware is a good example of this shift. It’s built around the idea that observability should be fast to deploy, unified across signals by default, and priced in a way that doesn’t create a finance conversation every time a team decides to instrument something new. For teams running Kubernetes and distributed services that need production-grade visibility without the onboarding overhead or unpredictable billing of legacy platforms, it offers a meaningfully different value proposition.
The broader trend is real regardless of which specific platform a team chooses: the “enterprise observability suite” model is losing ground to platforms that prioritize developer experience, OpenTelemetry-native pipelines, and operational simplicity.
Getting the Architecture Right
The teams getting observability right in 2026 share a few common traits. They’ve standardized on OpenTelemetry for instrumentation. They’ve consolidated signal types onto a single platform rather than running parallel stacks. And they’ve tied their observability investment directly to SLOs that matter to the business — not just system metrics that look good on a dashboard.
Well-done observability isn’t about having the most comprehensive monitoring. It’s about having the right signals, in the right place, fast enough to be useful when something breaks.
That framing shift, from “collect everything” to “correlate what matters,” is the difference between a team that spends incident response time fighting their tools and one that spends it fixing the actual problem.